This project started as hands-on image generation, not an abstract model experiment. I was working with SDXL (Stable Diffusion XL), an open text-to-image generation model, and the path felt natural: first run it locally on my own machine, then package the same work in a local container with Docker, then deploy that container to Azure Container Apps.
The local and local container stages were mostly smooth. They gave me enough confidence that moving from laptop to container to cloud would be more plumbing than discovery. The surprises showed up when self-hosting moved to Azure, where model files, process readiness, storage, and deployment behavior all became part of the system.
What the Model Produces
Before the surprises, here is what the self-hosted SDXL pipeline actually generates once it is loaded and running. These is direct output from the same code, unretouched.

This is the payoff I was working toward. The rest of the post is about everything that stood between the container starting and this image coming out.
The False Assumption
Calling a vendor API makes image generation look like one operation: send a request, get an image back. Self-hosting a generative model turns that single operation into a system I have to own.
I wanted control over inference settings, no lock-in to a hosted image API, and a cost model I could reason about. At the top level, the choice sounded simple: stop calling the vendor service and run the model myself.
That choice moved hidden responsibilities into my application boundary. I inherited the model runtime, storage lifecycle, readiness state, and deployment behavior. I also inherited the difference between persisted model assets and a process that has loaded the model and can generate an image.
The container was only the packaging format. Self-hosting meant owning everything the model needed after the container started.
The Architecture I Expected
The system shape looked straightforward before the edge cases showed up. Local code would become a web API, the web API would run in a container, and the deployed container would use external storage for the model cache.
The first version looked like this:
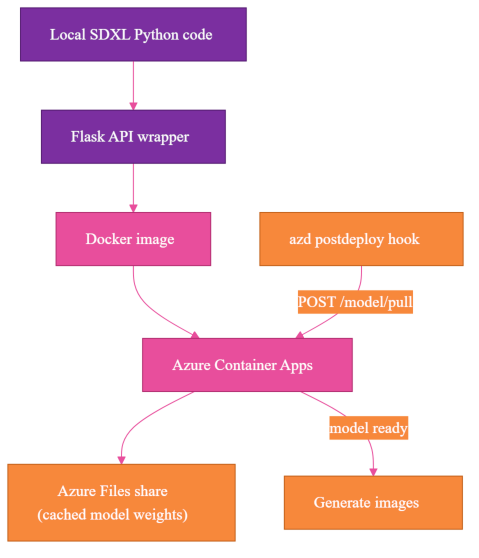
The concrete version ran my Flask-wrapped SDXL (Stable Diffusion XL, an open image-generation model) code in Docker on Azure Container Apps (ACA, the managed container hosting service used here), with an Azure Files share (a network-attached mount) for cached model weights. An azd (Azure Developer CLI) postdeploy hook—an automation step after deploy—pulled the model.
The real deployment runs on CPU in Azure Container Apps: 4 vCPU, 16Gi memory, device=cpu, and 136Gi ephemeral storage, the container's local scratch disk, wiped on restart. That 4 vCPU / 16Gi shape requires an Azure Container Apps Dedicated (D4) workload profile; the Consumption plan caps at 4 vCPU / 8Gi. The mounted Azure Files share holds the model cache, because the SDXL assets are too large to treat as incidental container filesystem state.
That architecture was directionally right, but it left out most of the operational work.
What Was Actually Happening
The first clean picture hid two separate truths: the container could be up without running Flask, and model files could exist without the process being ready.
Surprise #1: Persistent Storage Does Not Mean Warm Application State
The first lifecycle mistake was treating stored model assets as if they were the same thing as a ready application. Persistent storage can keep files between revisions, ACA's immutable deployment versions. It cannot keep a new container process warm.
After the first cold download succeeded, I expected the next revision to be warm. The model files were on the Azure Files share, the share was mounted, and the path existed.
Then the app reported readiness state held in the process's memory, through the /model/status state field:
{
  "state": "not_started"
}
That looked wrong until I separated two states I had been mentally combining:
- model assets persisted on disk
- model loaded and ready in this process
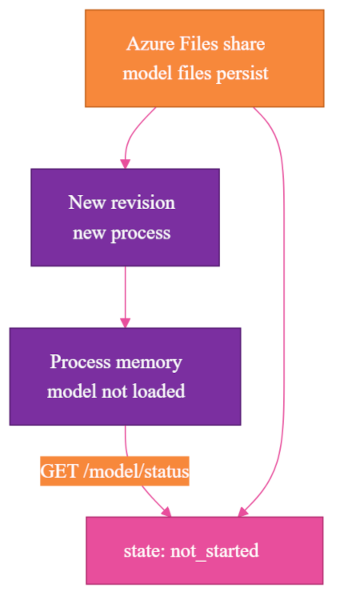
Those are not the same lifecycle. The Azure Files share can be warm while the container process is cold. A new revision starts a new process. That process can see the cached files, but it still has to initialize the SDXL pipeline in memory.
The specific not_started state did not mean "the share is empty." It meant "this process has not begun loading the model." The useful ready state was ready, also reported by /model/status.
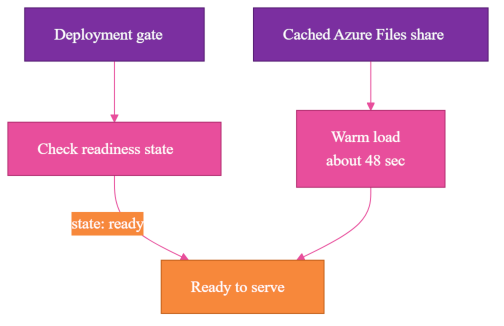
That distinction changed how I read status. A cold path downloads model assets and then loads the model. A warm path skips the download but still loads the model from the mounted cache. In my deployment, warm load from the cached share was about 48 seconds. Cold download took minutes.
Those are different costs, and they happen for different reasons. The deployment gate needed to care about readiness, not just file presence. Checking whether a directory exists is not enough. Checking whether the model cache is populated is not enough. The application has to report that this process is ready to serve generation requests.
Persistent storage keeps assets. It does not keep application memory warm. For model-serving systems, readiness is process state.
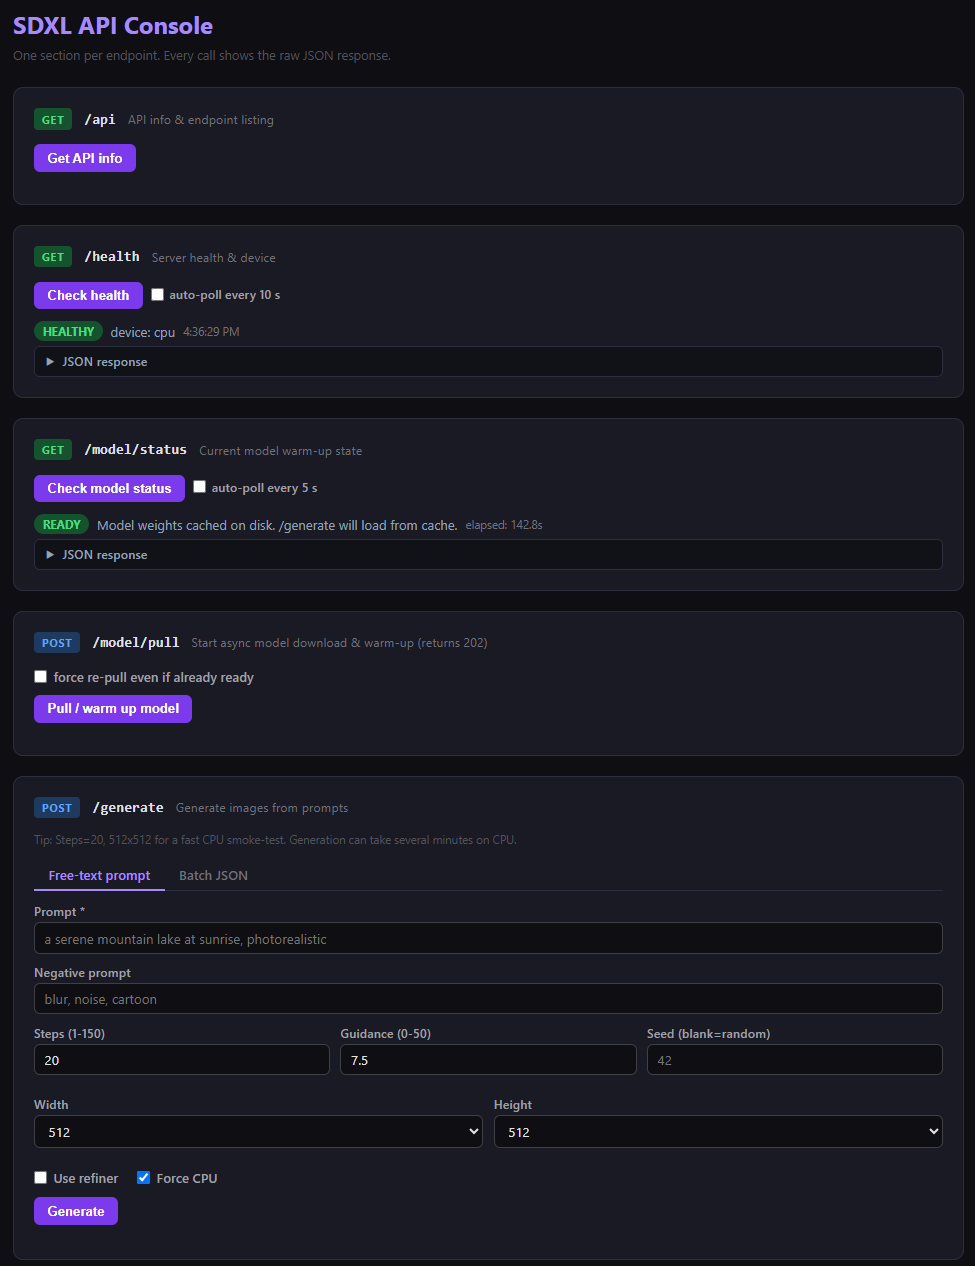
I built a small web console over these endpoints so I could see that distinction directly. Each endpoint the deployment depends on has its own section, and /model/status reports the process state in plain language: here it shows READY - Model weights cached on disk. /generate will load from cache, which is exactly the difference between "the files are on the share" and "this process can answer a request."
Surprise #2: Model Files Are Not Just Files
The next storage mistake was treating model acquisition as a small deployment detail. For a generative model, the weights are a deployable asset with their own lifecycle.
A model that is about 7GB in FP16, or roughly 14GB loaded as FP32 on CPU the way this deployment runs it, is not a small deployment detail. It is its own deployment phase.
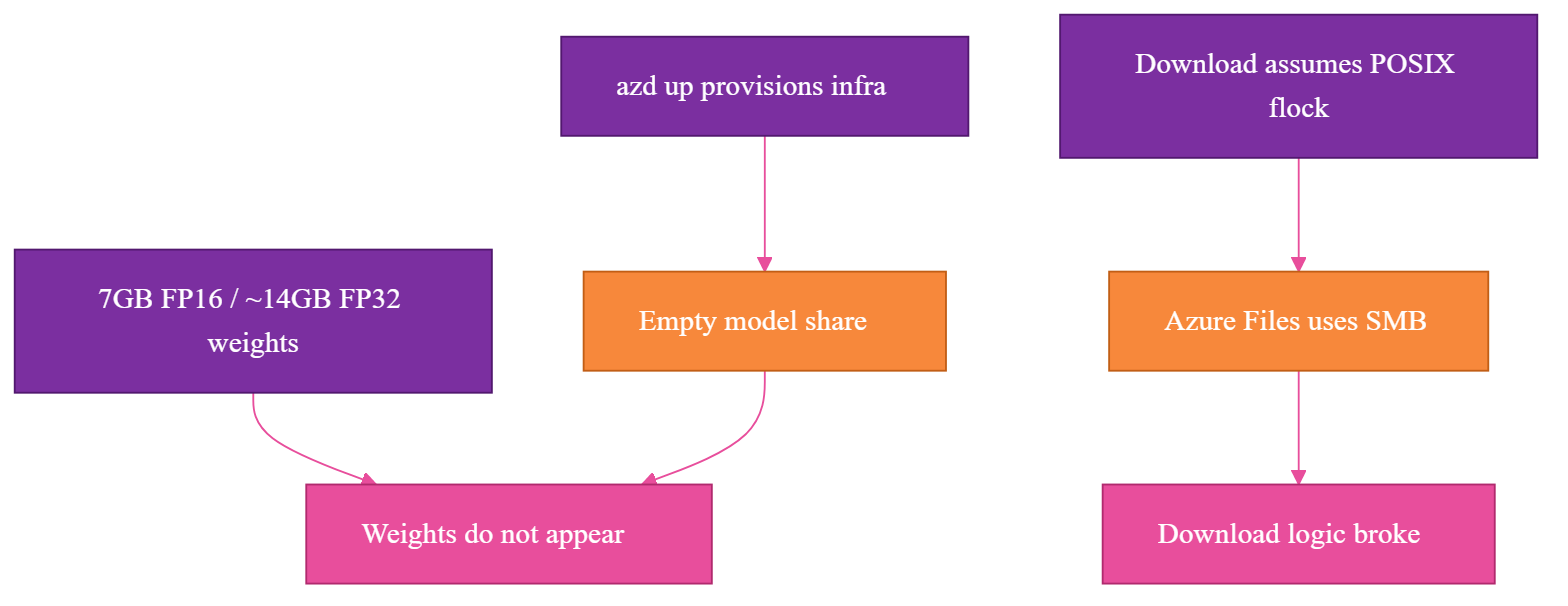
The model weights do not appear during azd up. Infrastructure provisioning creates the place where the model can live, but it does not populate that place with model assets.
I made model acquisition part of postdeploy. The deployment automation step that runs after deploy, the azd postdeploy hook, calls the app's model-download endpoint, POST /model/pull:
curl --fail -X POST "$APP_URL/model/pull"
Then it blocks until the app reports through the model-status endpoint, /model/status, that the model is ready:
curl --fail "$APP_URL/model/status"
A useful response includes the process readiness state, target device, and model path:
{
  "state": "ready",
  "device": "cpu",
  "model_path": "/models/stable-diffusion-xl-base-1.0"
}
That was the right shape, but the storage layer had its own constraints. The mounted network-attached file storage is an Azure Files share, which uses Server Message Block (SMB, the network file-sharing protocol Azure Files uses). SMB does not support POSIX flock, the file-locking call a local Linux filesystem supports. The first version of the download logic assumed file locking would behave like local disk, and that assumption broke on the mounted share.
That kind of bug feels like an operating system problem until you remember that self-hosting makes the filesystem part of the application architecture. I had to rework the download logic so the app did not depend on unsupported locking behavior on the mounted share.
Once that was fixed, the cold download was faster than I expected: about 2 minutes 23 seconds over the Azure backbone. The newer Hugging Face transfer path helped here; hf_xet, Hugging Face's newer fast download transport, replaced the deprecated hf_transfer, and the transfer itself was not the bottleneck I feared.
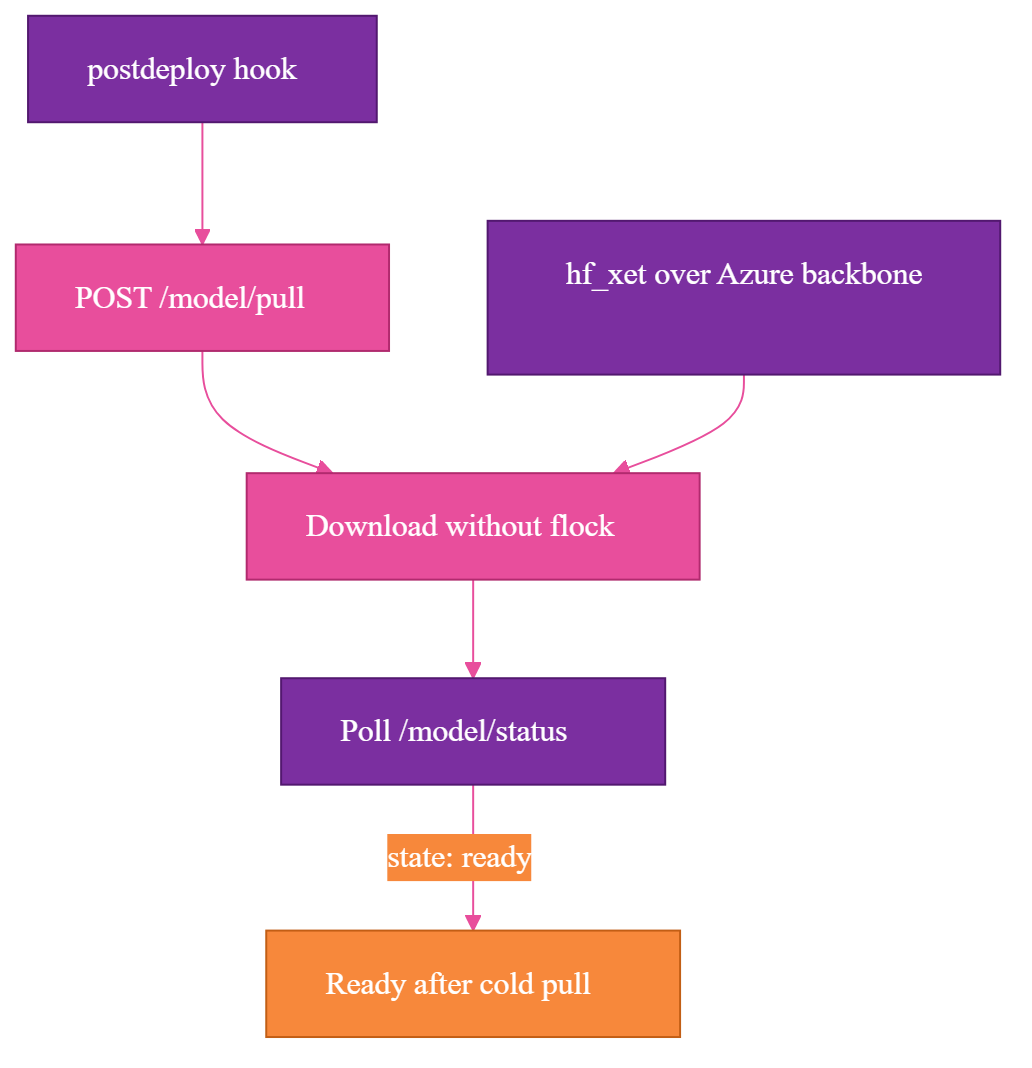
The useful takeaway was not simply that downloads can be fast. The model is a deployable asset with its own lifecycle. With a vendor API, the weights are someone else's problem. With self-hosting, model acquisition needs ordering, retries, logs, status, and a failure mode that stops the release instead of hiding the problem until the first image request.
Surprise #3: "CPU Offload" Doesn't Work on a CPU
The runtime mistake was trusting a helper name before checking the hardware contract behind it. I expected memory to be an issue, and it was. The memory-saving helper I reached for had a name that sounded perfect for CPU hosting but failed because the container was actually running on CPU.
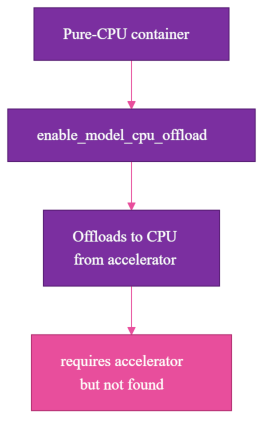
In diffusers, Hugging Face's Python library for running diffusion image models, the helper is enable_model_cpu_offload():
pipe.enable_model_cpu_offload()
The name sounds like exactly what a CPU deployment wants. I read it as: use CPU memory carefully, offload model pieces as needed, survive inside the container limits.
That is not what it means. On a pure-CPU container, it raises the kind of error that makes the naming clear:
requires accelerator, but not found
enable_model_cpu_offload() means "offload to CPU from an accelerator." It is for a system that has an accelerator and wants to move parts of the model back to CPU memory. It is not a CPU execution mode.
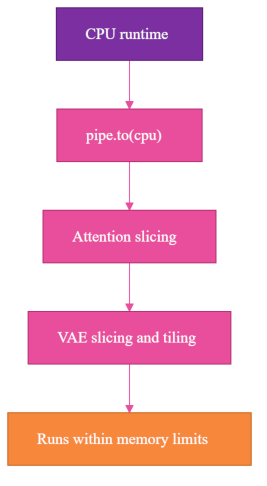
The fix was explicit CPU-safe initialization:
pipe = StableDiffusionXLPipeline.from_pretrained(
    model_path,
    torch_dtype=torch.float32,
    use_safetensors=True,
)

pipe.to("cpu")
pipe.enable_attention_slicing()
pipe.vae.enable_slicing()
pipe.vae.enable_tiling()
The idiomatic diffusers pipeline-level equivalents are pipe.enable_vae_slicing() and pipe.enable_vae_tiling(); both forms are equivalent.
The memory-saving calls here are literal: attention slicing computes attention in smaller chunks, and VAE (the variational autoencoder stage that decodes latents into the final image) slicing and tiling decode the image in pieces.
Model libraries encode hardware assumptions. Sometimes those assumptions are obvious. Sometimes they are hidden inside method names that sound like they were written for your exact scenario.
For this deployment, "CPU offload" means "offload to CPU from somewhere else." It does not mean "run on CPU." The app is not just my Flask routes; it is also the model runtime, tensor dtype, memory behavior, and hardware profile lining up correctly.
Surprise #4: The Container Was Running, But Not My App
The startup mistake was using a running container as proof that my application was running. A container can be healthy enough to accept traffic while the wrong process is listening.
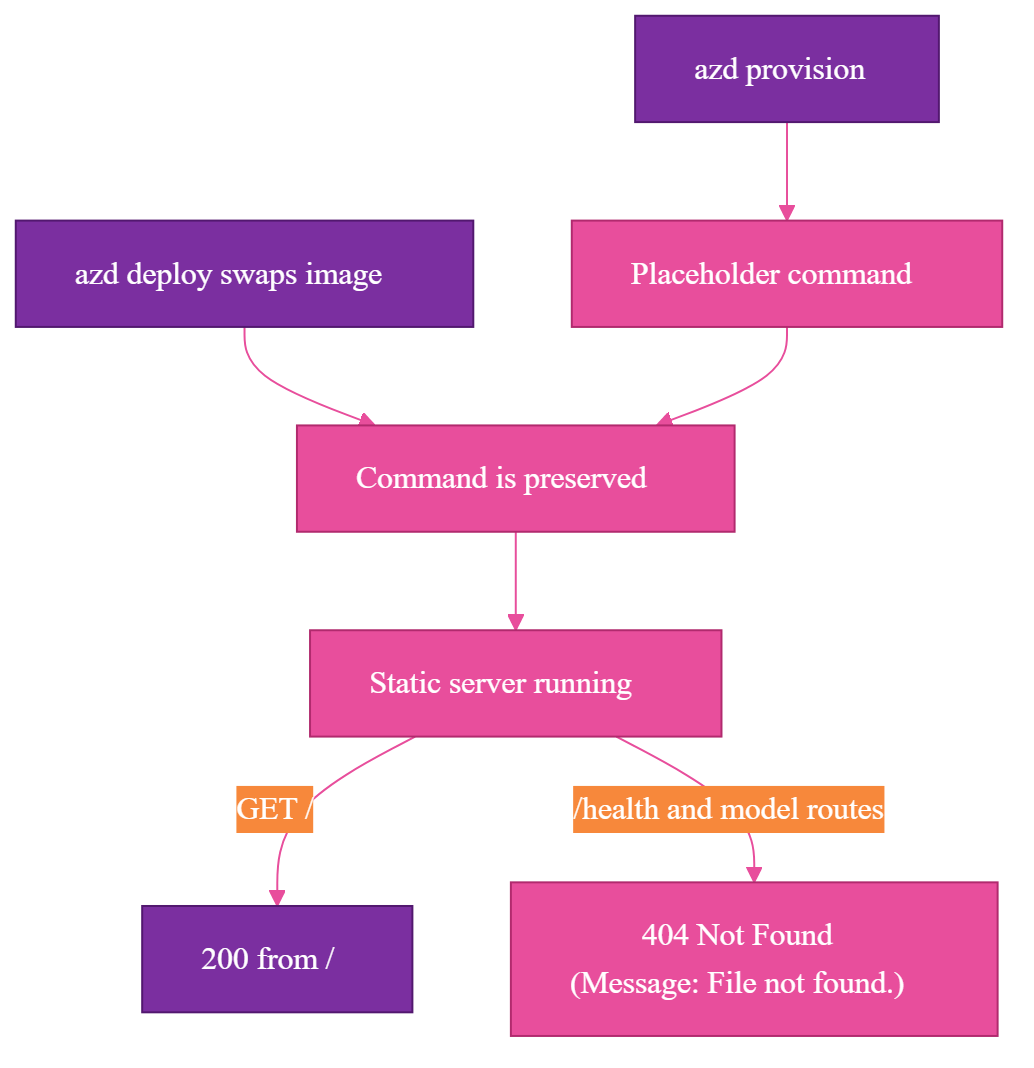
The container app was up, the revision existed, the endpoint responded, and GET / returned 200. Every real route still returned a 404 Not Found from Python's static file server, with this line in the HTML body:
At first, that looked like my Flask routing was broken. Maybe the app was not binding correctly. Maybe the container port was wrong. Maybe the health route was missing. Maybe the image was stale.
The error page pointed to the real problem. Message: File not found. is not Flask's default response; it is Python's SimpleHTTPRequestHandler, the built-in static file server returning its HTML error page. My container was running, but my Flask app was not.
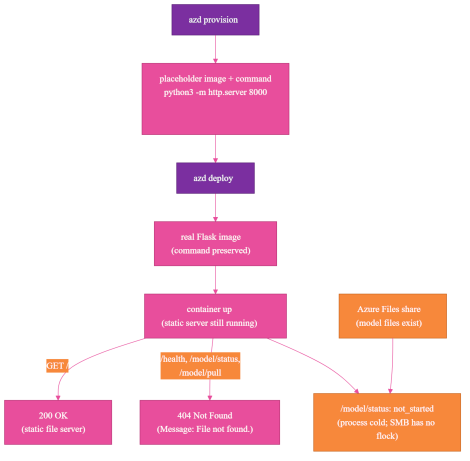
On a fresh environment, azd provisions the Azure Container App before the real application image exists. To make the infrastructure deployment succeed, it uses a temporary placeholder web server, python3 -m http.server 8000:
python3 -m http.server 8000
That is reasonable during provisioning. The surprise came later, when azd deploy swapped in my real Flask image and preserved the placeholder command. The image changed, but the runtime command did not.
So my real container image started successfully and then ran Python's static file server instead of my Flask app. That is why / returned 200, and why /health, /model/status, and /model/pull returned 404 Not Found responses whose HTML body said Message: File not found. Those routes only exist in Flask, and Flask was never running.
I stopped treating "container is up" as proof that the application is running. I added a self-heal step in the postdeploy hook that resets the command explicitly:
az containerapp update \
  --name "$CONTAINER_APP_NAME" \
  --resource-group "$RESOURCE_GROUP" \
  --command "python3" "app.py"
Then the hook waits for the actual application route before it does any model work:
curl --fail "$APP_URL/health"
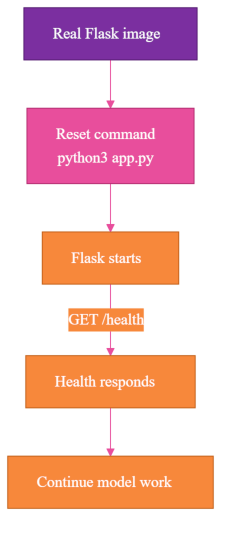
Only after /health responds from Flask does the deployment continue. Calling /model/pull before proving Flask is running is just sending a request to whatever process happens to be listening.
I now treat the command, the image, and the health endpoint as three separate facts. The deployment is not ready until all three are true.
The self-heal works, but it treats a symptom. The root cause is that the container command was set in the Bicep template, and azd deploy swaps only containers[0].image, so the placeholder command survives and overrides the image's own start command. The cleaner pattern is to put CMD ["python3", "app.py"] in the Dockerfile, remove command and args from the Bicep entirely so the image command is used, and gate readiness with an ACA startup probe on /health instead of a manual wait loop. I kept the self-heal hook because it is what is working in this deployment, but if I were starting clean I would remove the Bicep command override and let the image plus a startup probe do this job.
The verification mistake was trusting quiet tooling. Some failures throw obvious errors. Others look like nothing happened.
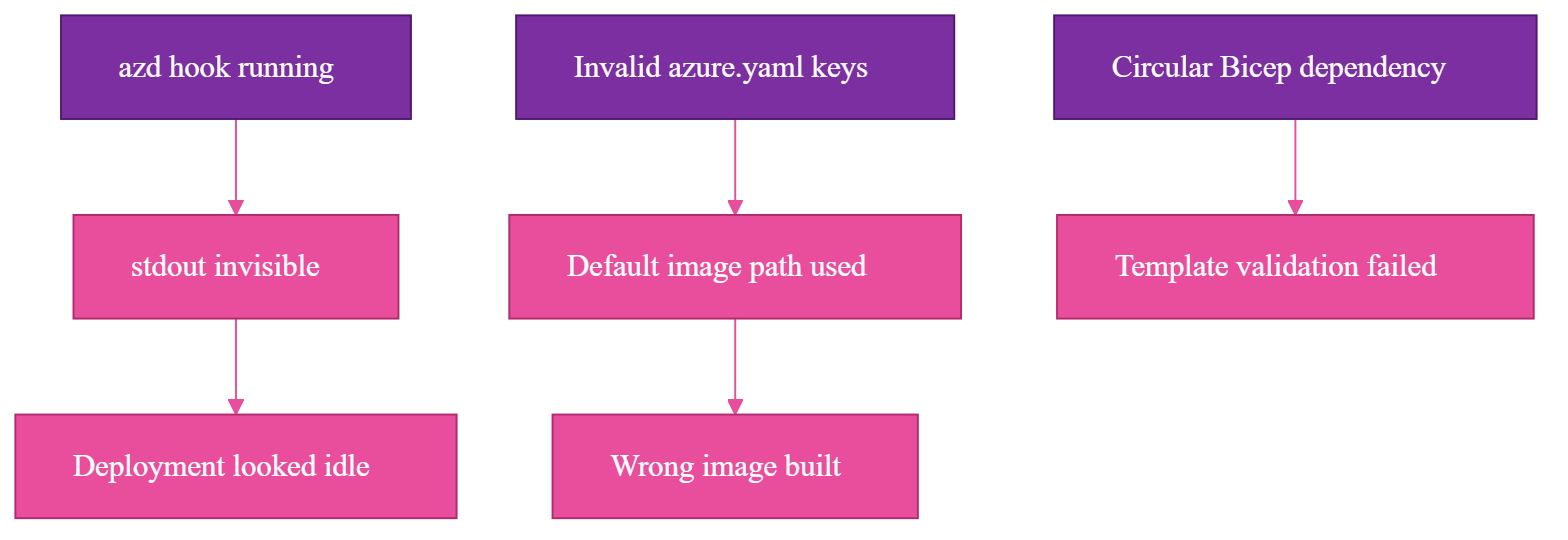
One problem was visibility. The azd postdeploy hook was running, but when its output was piped or non-interactive, stdout was invisible. Nothing in the terminal made it obvious what the hook was doing, so I verified through the platform logs:
az containerapp logs show \
  --name "$CONTAINER_APP_NAME" \
  --resource-group "$RESOURCE_GROUP" \
  --follow
Those logs became the source of truth.
Another problem was configuration shape. I had invalid keys in azure.yaml during one iteration. A top-level dockerfile: or port: looks plausible if you are moving fast, but azd did not fail the way I wanted. It ignored the invalid shape and fell back to default behavior.
The Dockerfile must be configured through the supported docker: block in azure.yaml:
services:
  image-generation:
    project: .
    language: docker
    host: containerapp
    docker:
      path: ./Dockerfile.cpu
      context: .
That small indentation decision changed what image was built.
The Dockerfile also had to default to the Flask server as its entrypoint. If the platform command was absent or wrong, the image still needed to know how to run the app:
CMD ["python3", "app.py"]
Without that default, ACA could end up in ContainerBackOff or ActivationFailed, ACA states for a container that cannot start or stay up, depending on which part of startup failed.
There was also an infrastructure bug: a circular dependency in the Bicep, Azure's infrastructure-as-code language, for the container app failed template validation until I broke the cycle. That was not an SDXL issue. The model deployment made the infrastructure graph more complicated, and the graph had to be correct before the app could even try to start.
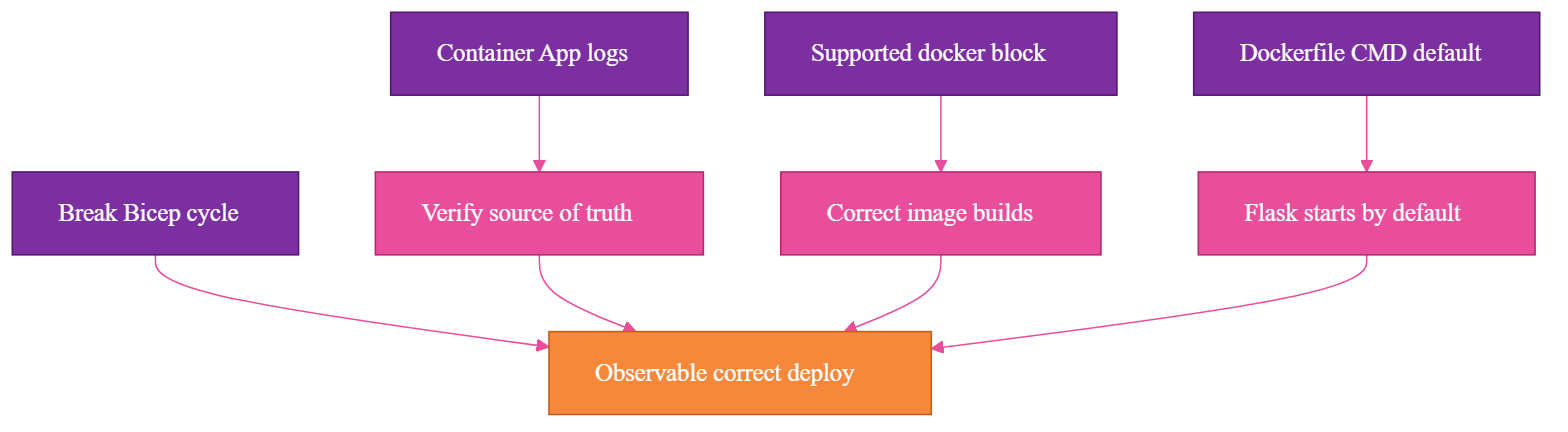
Automation needs observable verification. In this setup, a successful command did not prove the deployment was correct, a running container did not prove Flask was running, a mounted share did not prove the model was ready, and a quiet hook did not prove the hook was idle.
What the Final Architecture Became
The final shape is the concrete version of the earlier diagram. Each piece now has an explicit responsibility, and deployment gates on the application being ready, not just the infrastructure existing.
The container image defaults to Flask:
CMD ["python3", "app.py"]
The runtime behavior is explicitly CPU:
device=cpu
vCPU=4
memory=16Gi
ephemeral storage=136Gi
The model pipeline uses CPU-safe initialization:
pipe.to("cpu")
pipe.enable_attention_slicing()
pipe.vae.enable_slicing()
pipe.vae.enable_tiling()
Here too, the pipeline-level pipe.enable_vae_slicing() and pipe.enable_vae_tiling() calls are the idiomatic diffusers form.
The Azure Developer CLI configuration points at the CPU Dockerfile through the supported shape:
services:
  image-generation:
    language: docker
    host: containerapp
    docker:
      path: ./Dockerfile.cpu
      context: .
The postdeploy hook does four jobs, in order:
- Reset the container command to the Flask app.
- Wait for
/health so I know Flask is actually running.
- POST
/model/pull so model acquisition is part of deployment.
- Poll
/model/status until state is ready, with a configurable timeout and fail-fast behavior.
In shell form, the core idea is simple:
az containerapp update \
  --name "$CONTAINER_APP_NAME" \
  --resource-group "$RESOURCE_GROUP" \
  --command "python3" "app.py"

curl --fail "$APP_URL/health"
curl --fail -X POST "$APP_URL/model/pull"

until curl --fail "$APP_URL/model/status" | grep '"state":"ready"'; do
  sleep 10
done
The real script has more defensive handling, because production scripts should fail clearly. But that is the architecture.
The app owns readiness. The hook gates deployment on readiness. Logs validate reality. I did not end up with just a container that runs SDXL; I ended up with a deployment lifecycle for a self-hosted generative model.
The Decision Framework I Actually Trust Now
I still like the decision to self-host for this project. The tradeoff is just clearer now.
Self-hosting buys control over inference settings, portability, model loading strategy, and deployment lifecycle. It also moves hidden responsibilities into your application boundary: runtime assumptions, model storage, download orchestration, readiness, deployment verification, logs, sizing, and the difference between "files exist" and "the model can answer this request."
A vendor API charges for convenience, but the convenience is real. It is not just inference. It is the operational surface area you do not have to build.
For a prototype, that surface area may not be worth it. For a workflow where settings, portability, and control matter, it can be.
The question I trust now is simpler: do I want to own everything this model needs to be reliable?
Closing
Self-hosting SDXL showed me how much the vendor API had been handling. Once I owned the model, I owned the runtime, storage, lifecycle, readiness, and observability around it.
Self-hosting a generative model is not just replacing an API call with a container. It means the model is part of the system, with the same deployment and reliability responsibilities as the rest of the application.
And once all of that is in place, the model just does its job: