Copilot CLI Context Window: How I Cut Token Usage from 52% to 13%
I'll be honest: I started this whole investigation backwards. I had 117 skills consuming 413K tokens on disk and assumed that was the problem. I spent two hours optimizing them before I thought to actually measure what was in my context window. Turns out, skills are on-demand — they never touch the context window at all.
The biggest consumer was something I never would have guessed: a single plugin loading ~27K tokens of tool definitions into every message. This is the story of how I found it, scoped it down, and — importantly — how you can configure it to match your workflow without losing functionality.
What makes this different? There are already several great articles about MCP context optimization (devbolt.dev, The New Stack, StackOne, blog.pamelafox.org). This one adds: real measured token numbers from a production setup, the
/contextcommand as a diagnostic tool, the Azure MCP namespace scoping solution, and the Squad orchestration angle.
Step 1: Measure First — Check Your Token Breakdown
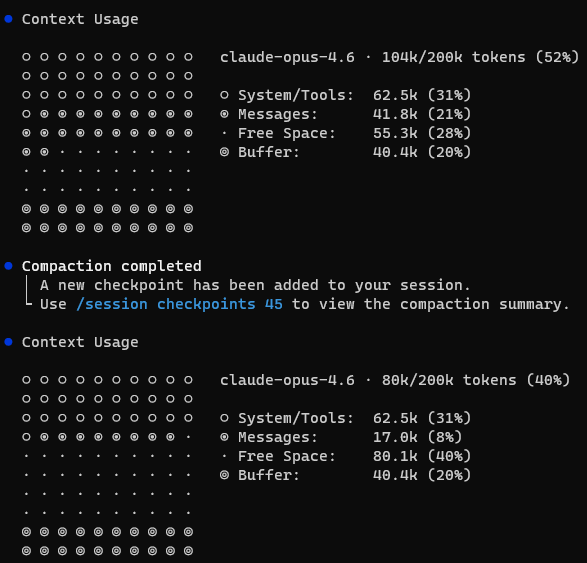
I run GitHub Copilot CLI with a multi-agent orchestration setup — half a dozen MCP servers, several plugins, and 117 skills. Mid-session, I got curious about what my context window actually looked like and ran /context:
Context Usage
  claude-opus-4.6 · 104k/200k tokens (52%)

  System/Tools:  62.5k (31%)
  Messages:      41.8k (21%)
  Free Space:    55.3k (28%)
  Buffer:        40.4k (20%)
52% consumed before typing a single message. The System/Tools bucket alone was 62.5K tokens — 31% of my 200K window. That's the baseline cost of my setup: agent instructions, MCP tool definitions, system prompt, memories.
With only 28% free space, complex multi-agent tasks would trigger compaction mid-session. I needed to find what was actually consuming those 62.5K tokens — and the only way to know for sure was to audit what's always-loaded vs. what lives on disk.
Step 2: Distinguish Always-Loaded from On-Demand
The first question to ask is not "what's biggest?" but "what's always in context?"
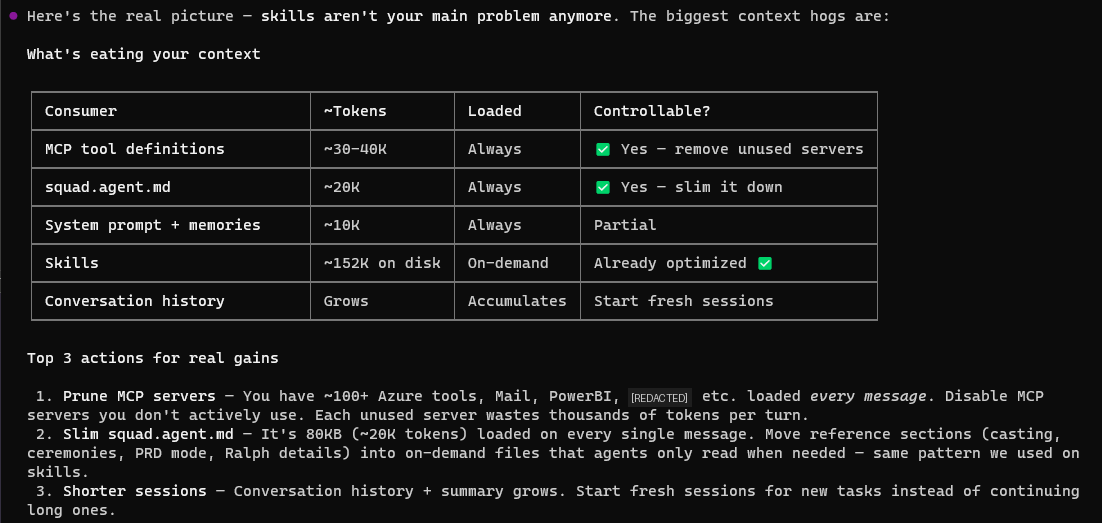
The System/Tools bucket contains everything that loads on every message — unconditionally. If I can reduce that, every operation gets cheaper. Optimizing anything else only helps specific operations.
I built a breakdown:
| Consumer | ~Tokens | When Loaded | Controllable? |
|---|---|---|---|
| MCP/Plugin tool definitions | ~27K+ | Every message | ✅ Scope or remove |
| Agent instructions | ~20K | Every message | ✅ Slim it down |
| System prompt + memories | ~10K | Every message | Partial |
| Skills | ~143K on disk | On-demand only | Can optimize, but won't help context |
| Conversation history | Growing | Accumulates | Fresh sessions help |
Key insight: Skills sit on disk until an agent explicitly requests one. They are never in the context window. Optimizing them makes individual agent spawns cheaper and faster — valuable for performance — but they don't contribute to System/Tools at all. (I learned this after spending two hours optimizing them. Do as I say, not as I did.)
Step 3: Audit What's Always-Loaded
The mystery is: what's in that 62.5K System/Tools bucket?
MCP Tool Definitions (~6–10K tokens)
MCP servers inject their tool schemas into every message. I had:
- GitHub MCP — ~15 tools (issues, PRs, code search, actions)
- Mail MCP — ~20 tools (search, send, reply, forward, attachments)
- PowerBI MCP — ~6 tools (execute query, generate query, get schema)
- M365 Agents Toolkit — ~4 tools (knowledge, snippets, schema, troubleshoot)
- IDE — ~2 tools (diagnostics, selection)
These are real — about 47–55 tools across all servers. But they're only ~6–10K tokens total. Where's the other 50K?
The Azure Plugin (~27K tokens) — The Biggest Consumer
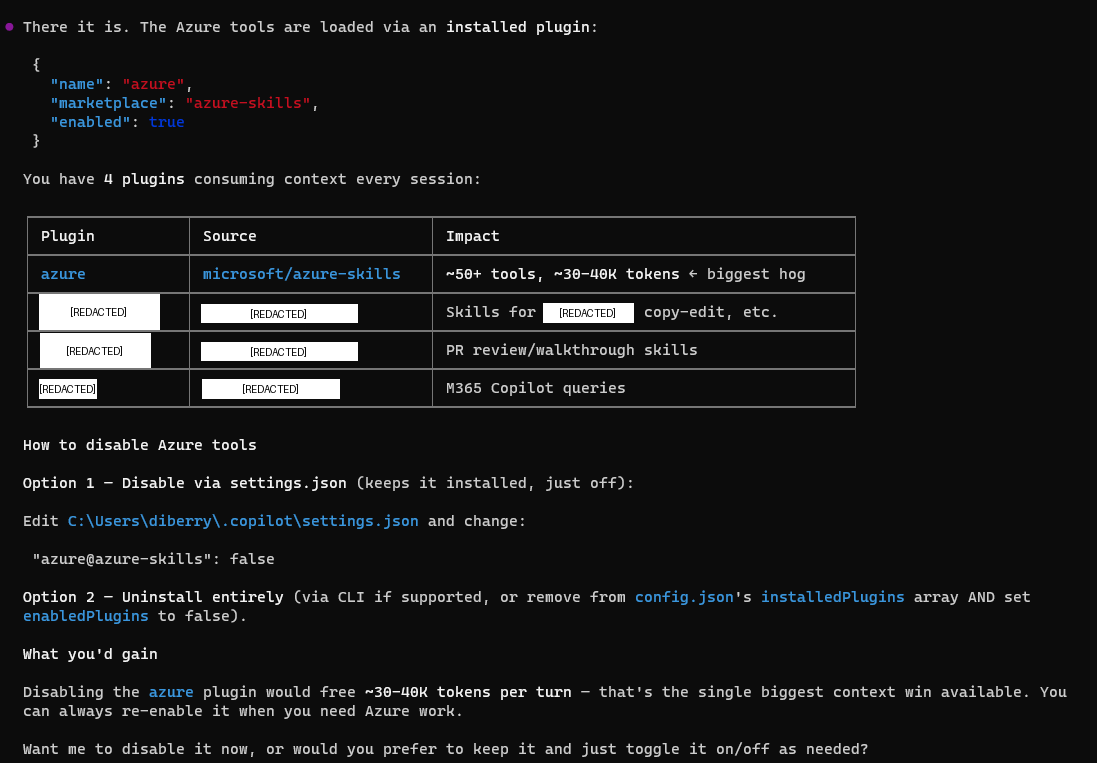
I checked ~/.copilot/settings.json and found the Azure plugin enabled:
| Plugin | Source | Impact |
|---|---|---|
| azure | microsoft/azure-skills | 50+ tools, ~27K tokens |
Here's the thing about the Azure MCP Server: it's comprehensive. Version 3.0.0-beta.6 has 259 tools across 56 namespaces — covering everything from ACR to Virtual Desktop to Well-Architected Framework. That breadth is genuinely impressive, and the team clearly designed it to be a one-stop shop for Azure developers.
The good news: the team also thought carefully about how developers actually work. They built in namespace scoping and mode selection so you don't have to load the entire surface area. In its default "namespace" mode, it groups tools by service — but if you're only using a few services, you can filter down to just those. More on that in a moment.
In my case, the default configuration was loading 50+ tool schemas into every message — even when I wasn't doing Azure work in that session. Not a bug, just a configuration I hadn't tuned yet.
Agent Instructions (~20K tokens)
My agent governance file — .github/copilot-instructions.md at the repo root — is 80KB. It loads on every turn. This is the ongoing cost of a sophisticated agent setup: the orchestration rules are comprehensive, and they load unconditionally whether I need them or not.
Step 4: Scope the Azure Plugin to Match How You Work
Once I understood the breakdown, the fix was straightforward. The Azure MCP team built exactly the right lever for this — namespace scoping lets you declare which services matter for your project and ignore the rest. No functionality lost, just a tighter fit.
Option A: Disable Entirely (Full removal)
If you genuinely don't use Azure, just turn it off:
// ~/.copilot/settings.json
"azure@azure-skills": false
This is what I did initially — it dropped System/Tools from 62.5K → 35.2K, freeing ~27K tokens instantly.

Option B: Namespace Scoping (Surgical — Recommended)
This is where the Azure MCP Server's design really shines. The team built namespace filtering specifically for this use case — you declare the services relevant to your project, and only those tool schemas load into context.
Configure it in your MCP settings with the --namespace flag:
--namespace appservice --namespace cosmos --namespace keyvault --namespace storage
This gives you 4 namespaces (~24 tools) instead of 56 namespaces (~259 tools) — a significant reduction in context usage while keeping the Azure tools you actually use.
Azure MCP Modes
The server supports 4 modes that control how tools are exposed:
| Mode | Behavior | Best For |
|---|---|---|
| namespace (default) | One tool per service namespace | Copilot — good balance |
| consolidated | Groups operations by user intent | Natural language workflows |
| single | One routing tool for everything | Maximum simplicity |
| all | Every operation as a separate tool (259!) | Maximum granularity — high context cost |
Pick Your Stack
Here's a quick reference for common developer personas:
| If you work with... | Namespaces to keep |
|---|---|
| Web apps | appservice, cosmos, keyvault, storage, functions |
| Data/Analytics | cosmos, sql, kusto, eventhubs, storage |
| DevOps/Infra | compute, aks, azureterraform, deploy, monitor |
| AI/ML | foundryextensions, search, speech, applicationinsights |
All 56 Namespaces (Reference)
For the curious, here's the full list with tool counts. Use this to build your own --namespace filter:
| Namespace | Tools | Namespace | Tools | Namespace | Tools |
|---|---|---|---|---|---|
| acr | 2 | advisor | 1 | aks | 2 |
| appconfig | 5 | applens | 1 | applicationinsights | 1 |
| appservice | 7 | azurebackup | 16 | azuremigrate | 2 |
| azureterraform | 10 | azureterraformbestpractices | 1 | bicepschema | 1 |
| cloudarchitect | 1 | communication | 2 | compute | 12 |
| confidentialledger | 2 | containerapps | 1 | cosmos | 2 |
| datadog | 1 | deploy | 5 | deviceregistry | 1 |
| eventgrid | 3 | eventhubs | 9 | extension | 3 |
| fileshares | 14 | foundryextensions | 7 | functionapp | 1 |
| functions | 3 | grafana | 1 | group | 2 |
| keyvault | 8 | kusto | 7 | loadtesting | 6 |
| managedlustre | 18 | marketplace | 2 | monitor | 16 |
| mysql | 6 | policy | 1 | postgres | 6 |
| pricing | 1 | quota | 2 | redis | 2 |
| resourcehealth | 2 | role | 1 | search | 6 |
| servicebus | 3 | servicefabric | 2 | signalr | 1 |
| speech | 2 | sql | 13 | storage | 7 |
| storagesync | 18 | subscription | 1 | virtualdesktop | 3 |
| wellarchitectedframework | 1 | workbooks | 5 |
VS Code Users
You can also scope Azure MCP visually: click the gear icon next to the chat panel → select/deselect at the server, namespace, or individual tool level. No config files needed.
Other Filtering Options
- Individual tools:
--tool azmcp_storage_account_get --tool azmcp_cosmos_queryfor surgical precision - Combine namespace + tool filters for maximum control
Step 5: Then Optimize On-Demand Content (Optional)
Now that the always-loaded problem was solved, it was the right time to optimize skills — not because they consume context window (they don't), but because they improve individual agent spawn performance.
I spent two hours optimizing 117 Copilot CLI skills — reducing them from 413K to 143K tokens on disk, a 65% reduction. The process used waza_tokens to find bloated skills and patterns like reference extraction and checklist compression.
This didn't move the System/Tools percentage. But it made agent spawns faster and cheaper to run. Both wins are real — you just optimize them for different reasons.
Step 6: Measure Results
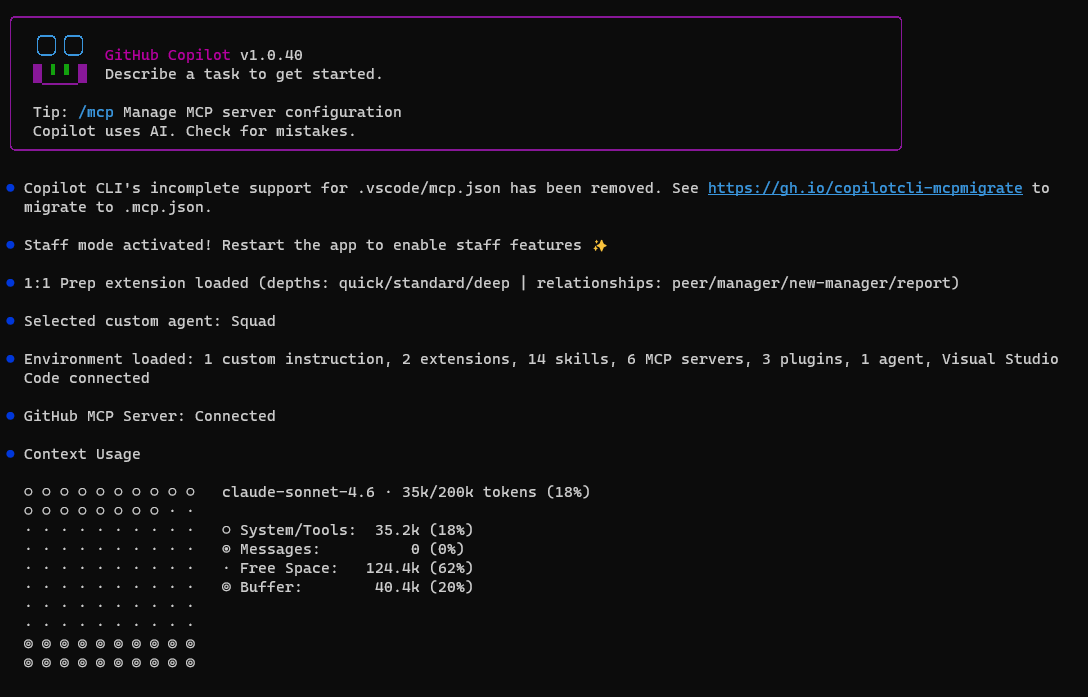
After scoping the Azure plugin:
System/Tools:  35.2k (18%)
Total usage:   ~70k/200k (35%)
Free Space:    ~90k (45%)
After upgrading the agent coordinator file:
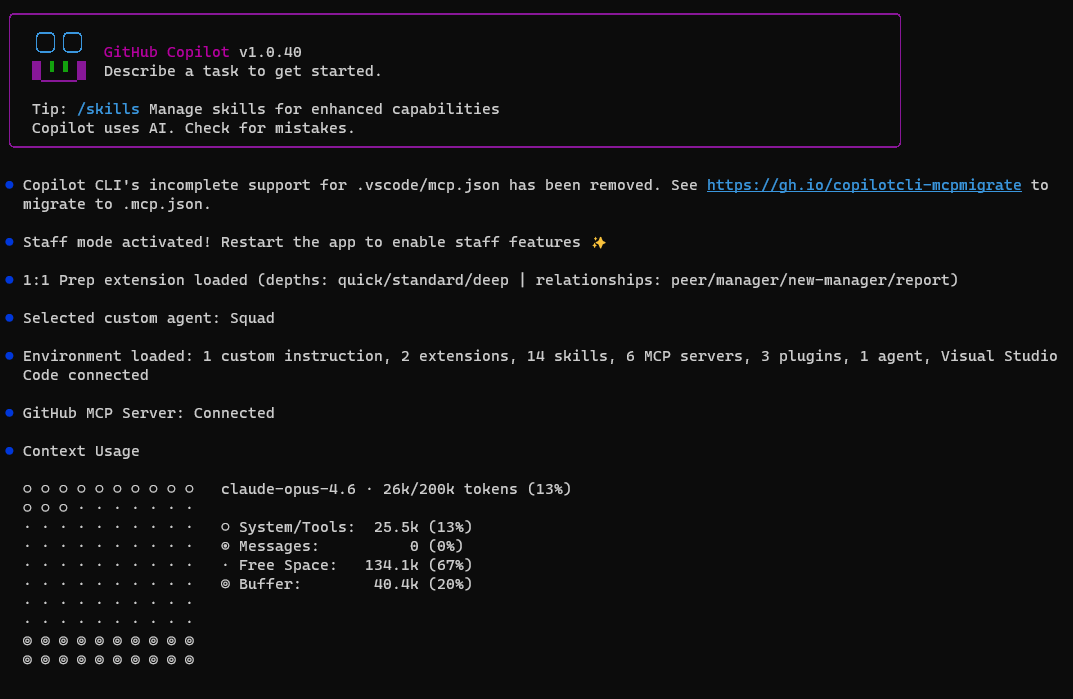
System/Tools:  25.5k (13%)
Total usage:   26k/200k (13%)
Free Space:    134.1k (67%)
The remaining ~10K drop from 35.2K → 25.5K came from upgrading my agent coordinator file — the new version replaced the old 80KB governance prompt with a leaner one. Skill optimization (270K saved on disk) didn't affect this number because skills are on-demand and never in the context window.
The Scorecard
| Action | Tokens Freed | Effort | Context Impact |
|---|---|---|---|
| Scope Azure plugin | ~27K | Config change | Significant — always loaded |
| Upgrade agent coordinator file | ~10K | 1 command | Significant — always loaded |
| Optimize 117 skills | ~270K on disk | 2 hours, 106 files | Zero on context — but faster agent spawns |
System/Tools went from 62.5K → 25.5K. Free space went from 28% → 67%. That's 2.4x more room for actual work.
The counterintuitive lesson: The biggest token savings came from the smallest changes — because I measured first instead of guessing.
Why Measurement First Matters
Most people (including me, initially) assume the biggest files on disk must be the problem. It's intuitive. It's wrong.
Skills: 143K on disk → 0K in context. Azure plugin: 50+ tools → ~27K in context every message.
Without checking /context, I would have spent all my time optimizing the wrong thing. I did optimize skills first (and it was worthwhile for other reasons), but the crucial discovery was always-loaded vs. on-demand. I'm reframing my mistake as a teaching moment: measure first, then optimize.
Quick Diagnostic Guide
This is the methodology. Use it whenever context runs tight:
- Run
/context— see your actual breakdown - Check plugins —
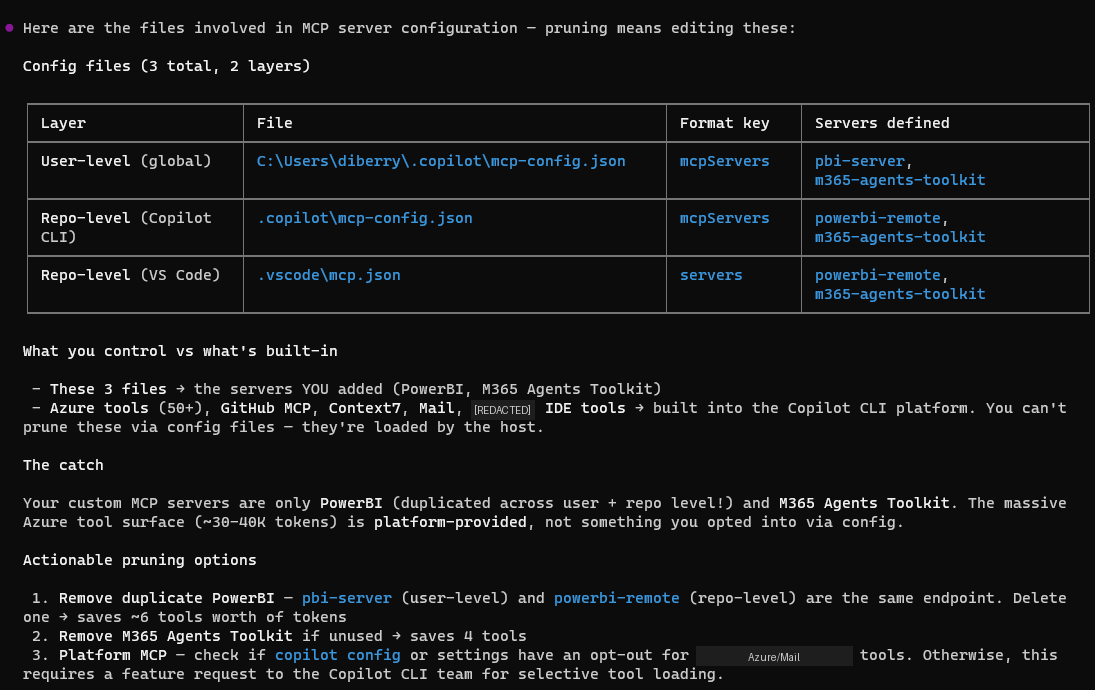
~/.copilot/settings.json— scope or disable unused ones (biggest wins are usually here) - Scope your MCPs — use namespace filtering, tool filtering, or mode selection to load only what you need
- Check MCP servers —
~/.copilot/mcp-config.jsonand.copilot/mcp-config.json— remove servers you don't use daily - Check agent instructions — if you use custom agent governance files, they load every turn
- Skills are usually fine — they're on-demand, not always-loaded
- Start fresh sessions — conversation history accumulates; don't run marathon sessions
The biggest wins are almost always in steps 2–3. Scoping one plugin can save more context than hours of file optimization.
What About Hooks?
One thing I haven't tested yet: Copilot hooks (commit hooks, pre-push hooks, custom event hooks). These are lightweight by design — they're shell scripts or short instructions, not loaded into the context window the way MCP tool definitions are. They fire on specific events rather than sitting in the always-loaded bucket.
That said, if you have hooks that reference large config files or trigger MCP calls, those downstream effects could impact context during execution. Worth running /context before and after adding hooks to verify. My expectation is minimal impact, but I'll update this post once I've measured it directly.
The Setup
- GitHub Copilot CLI v1.0.40
- Squad v0.9.4-insider.1 for multi-agent orchestration
- 117 skills in
.copilot/skills/— now ~143K tokens (optimized) - 5 MCP servers (GitHub, Mail, PowerBI, M365 Agents Toolkit, IDE)
- Azure plugin: scoped to needed namespaces (the one that mattered)
- Model: Claude Opus 4.6 with 200K context window
Investigation: May 5, 2026. The key lesson: measurement comes before optimization. Run /context and let the data guide your effort, not your intuition about file sizes. And when you find an MCP consuming more than you need — scope it down to match how you actually work.
The skills optimization ran same session — 117 skills reduced by 65% (413K → 143K tokens on disk) using waza tools.